
Official figures updated through 2026 show Sydney candidates are now at a coin flip, every Western Australian test centre sits below 50 per cent, and the gap between Australia’s easiest and hardest centres runs to 57 points. Where you book is the one part of this you control.
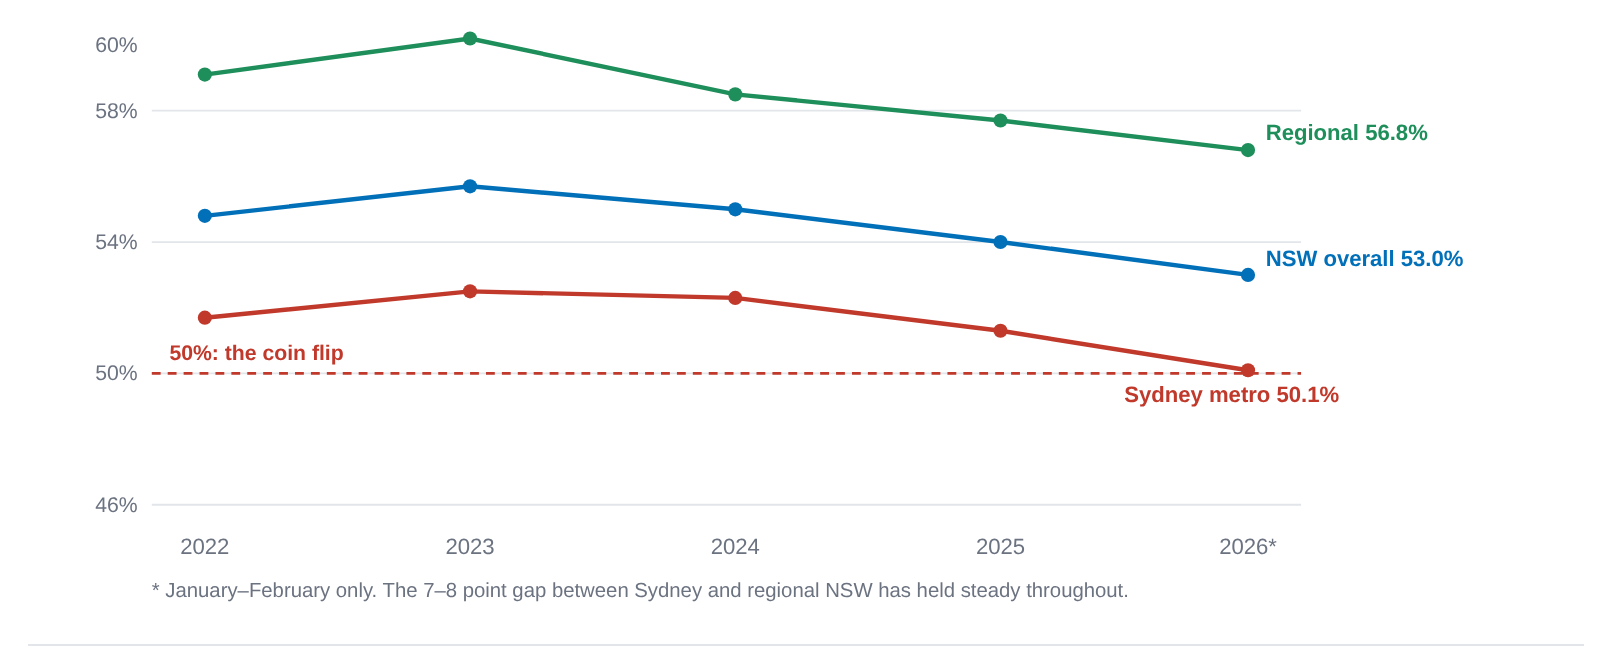
Ask anyone in Australia what the driving test pass rate is and you will usually hear 56 per cent. That number came from EzLicence’s analysis of about 30,000 tests taken in 2022 and 2023, and it has echoed through driving school blogs and news segments ever since. The newest official figures put it lower. In New South Wales, the state that owns the 56, the pass rate has slid to 54.0 per cent for 2025 and 53.0 per cent in the first two months of 2026, and inside Sydney it has fallen to 50.1 per cent. In the state’s biggest city, booking a driving test is now statistically a coin flip.
We pulled together the most recent official releases available in October 2026: Transport for NSW open data covering roughly 1.4 million tests from mid-2022 to early 2026, a Western Australian Freedom of Information release covering 292,253 tests, and a Victorian FOI release covering 492,504 tests between January 2024 and April 2026. Put side by side, they show that the national picture ranges from 72 per cent in Victoria to 42 per cent in WA, that the centre you choose can move your odds by 38 percentage points, and that many of the conflicting numbers circulating online differ because they answer different questions.
The 56% figure is already out of date, and the trend is down
Transport for NSW publishes test results for every centre on its open data portal. Weighted by the number of tests, the statewide car pass rate peaked at 55.7 per cent in 2023 and has dropped in each year since. Regional NSW still passes seven or eight points above Sydney, but both lines point the same way.
NSW is getting harder to pass, year by year
Weighted practical driving test pass rates, statewide, Sydney metro and regional NSW, 2022 to early 2026
The falling trend is landing on a system already under strain. The ABC reported in August 2025 that NSW learners were waiting six to eight weeks for a slot after a record 396,000 driving tests the previous financial year, up 12 per cent. Service NSW attributed the surge to the now-reversed policy that forced Australian citizens and permanent residents holding an overseas licence to pass the local test within three months, and said about half of those overseas drivers fail and rebook. Every fail feeds back into the queue, which is one reason a candidate who fails at a hard centre can end up waiting two months for a rematch.
The national scoreboard: 72% in Victoria, 42% in WA
The cleanest recent comparison across states comes from official releases rather than platform data, though each covers a slightly different window and counts differently (per-centre averages, first attempts or all attempts, as noted under each bar).
Where the licences are won and lost
Most recent official state pass rates available as of October 2026
SA (~80% first attempt), Tasmania and the NT do not publish comparable centre-level or test-level series. ACT figure is first attempts only (EzLicence FOI analysis via news.com.au, March 2026); the others count all attempts.
The standout is Western Australia, where the official average is 42.3 per cent and not a single one of the state’s 23 reporting centres reaches 50. WA’s own data points at a structural explanation: it requires just 50 logged supervised hours before a learner can test, half what NSW and Victoria demand.
Fewer mandatory hours, lower pass rates
Required supervised driving hours versus state pass rate, five jurisdictions
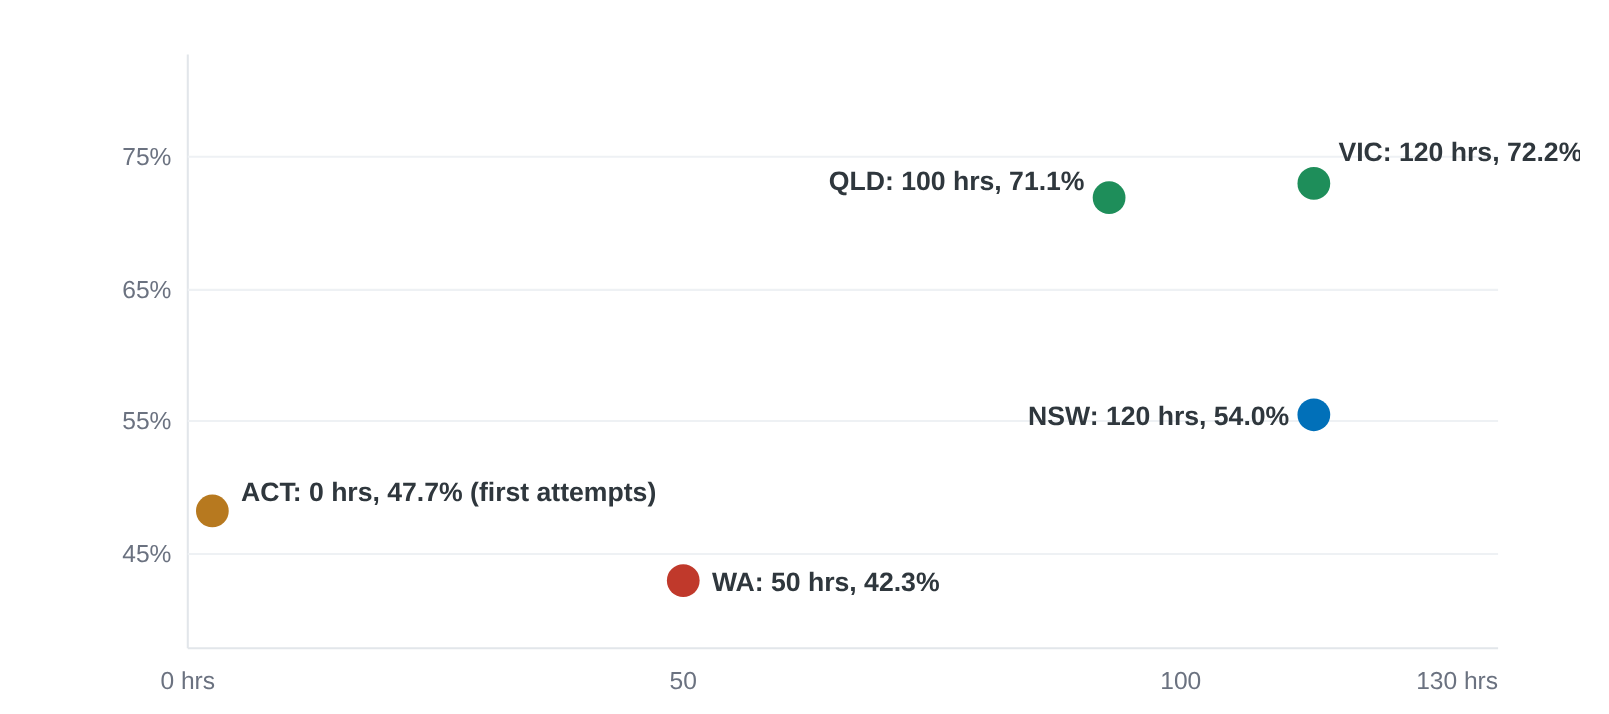 Pattern, not proof: test design, candidate mix and lesson markets also differ between states (AUDrive, April 2026).
Patrick O’Connor, a WA driving instructor quoted in EzLicence’s Pass Rate Paradise study, said: “Pass rates in Perth are indicative of less experienced learners taking the driving test.” WA’s government has since moved to raise its supervised-hours requirement, and this data is the strongest public argument that the reform addresses a real gap.
The postcode lottery: 38 points between NSW’s best and worst centres
Within NSW, the same test, the same fee and the same marking criteria produce wildly different outcomes depending on where you book. The five easiest centres, all regional, pass more than three of every four candidates, while the five hardest, all in Sydney, fail more than half.
Easiest and hardest NSW test centres
Easiest and hardest NSW driving test centres, pass rate, mid-2022 to early 2026
Across a 38.2-point spread inside one state, a candidate booking at Auburn needs, on average, more than twice as many attempts to pass as one booking at Inverell.
The pattern repeats everywhere the data exists. Queensland shows the same split: Brisbane North passes at 50.4 per cent across 16,444 tests, Bundaberg at 76.8 per cent. The Sydney Morning Herald’s 2024 analysis of TfNSW figures found 93 per cent of candidates from the Inverell local government area passed, against 47 per cent in Willoughby and 49 per cent in Ryde. NRMA spokesman Peter Khoury called the inconsistencies between neighbouring local government areas nonsensical: “We want it to be safe, but these sorts of inconsistencies don’t make a lot of sense.”
Nationally, the hardest centres are a Western Australian list. Based on the WA FOI release and AUDrive’s compilation, here are the ten toughest places in Australia to pass a driving test:
Australia’s ten hardest test centres
| # | Centre | State | Pass rate | Source |
|---|---|---|---|---|
| 1 | Midland | WA | 28.3% | WA DoT FOI |
| 2 | Mirrabooka | WA | 31.3% | WA DoT FOI |
| 3 | City West Perth | WA | 34.1% | WA DoT FOI |
| 4 | Bunbury | WA | 36.4% | WA DoT FOI |
| 5 | Rockingham | WA | 38.3% | WA DoT FOI |
| 6 | Kelmscott | WA | 39.3% | WA DoT FOI |
| 7 | Butler | WA | 41.6% | WA DoT FOI |
| 8 | Joondalup | WA | 42.8% | WA DoT FOI |
| 9 | Mandurah | WA | 43.1% | WA DoT FOI |
| 10 | Auburn | NSW | 47.0% | TfNSW open data |
Why the gap exists: four competing explanations
Transport for NSW’s official position is that the test resists geography. A spokeswoman told the Herald the practical test “is designed to produce consistent results regardless of who is conducting the test, the test route, location and prevailing traffic conditions,” while acknowledging that pass rates may reflect candidate mix: people converting interstate or overseas licences, or seeking modified licences, plus “the prevalence of professional driving lessons”.
The candidate-mix explanation has real force in western Sydney, where centres like Auburn and Merrylands serve large numbers of experienced overseas drivers converting their licences, a cohort Service NSW itself said fails at roughly twice the normal rate. But four mechanisms keep coming up in the research:
Traffic complexity: Sydney tests run through dense traffic light networks, school zones and multi-lane roundabouts. University of Sydney researcher Jacob Elmasry noted in the Herald that “urban driving has a lot of traffic lights, school zones and general traffic whereas rural roads are usually wider and less occupied.” The difficulty is built into the test route itself.
Experience before the test. Rural learners often drive on farms and quiet roads years before they sit the test; Elmasry points out they frequently start driving before 16. WA’s 50-hour minimum produces the same effect statewide: less practice, lower pass.
Access to lessons: Professional lessons at $70 to $90 an hour are a strong predictor of passing, and lesson supply and affordability differ sharply between suburbs and towns, which is one reason TfNSW’s own caveat lists lesson prevalence as a factor.
Examiner variation: Elmasry says perfect consistency across examiners is unachievable: “Some may be less observant than others. Others may be more willing to let things go.” Learner forums are full of similar stories. One commenter on r/sydney described an Edmondson Park examiner who failed an acquaintance three times running, including once on a test where the candidate’s sheet showed no faults recorded. TfNSW does not publish examiner-level data, so this remains anecdote rather than measurement.
“If a majority of kids are showing up at Willoughby and failing, what are we doing to address that?”
Why the pass-rate numbers disagree
For NSW alone, recent sources give you 54.0 per cent (TfNSW weighted, 2025), 56.5 per cent (AUDrive’s all-time figure), 58.5 per cent (first attempts, 2025, via EzLicence), 61.7 per cent (an unweighted average of NSW’s 149 centre rates), and 66.1 per cent (a Novated Lease “first pass rate” from 2024). None of them is wrong; each answers a different question, and most sources never say which one.
The Victorian data makes the trick visible in one clean example. VicRoads’ FOI release divides 492,504 tests into three outcomes:
One hundred Victorian drive tests, every outcome counted
Outcomes of 492,504 car drive tests, January 2024 to April 2026, scaled to 100
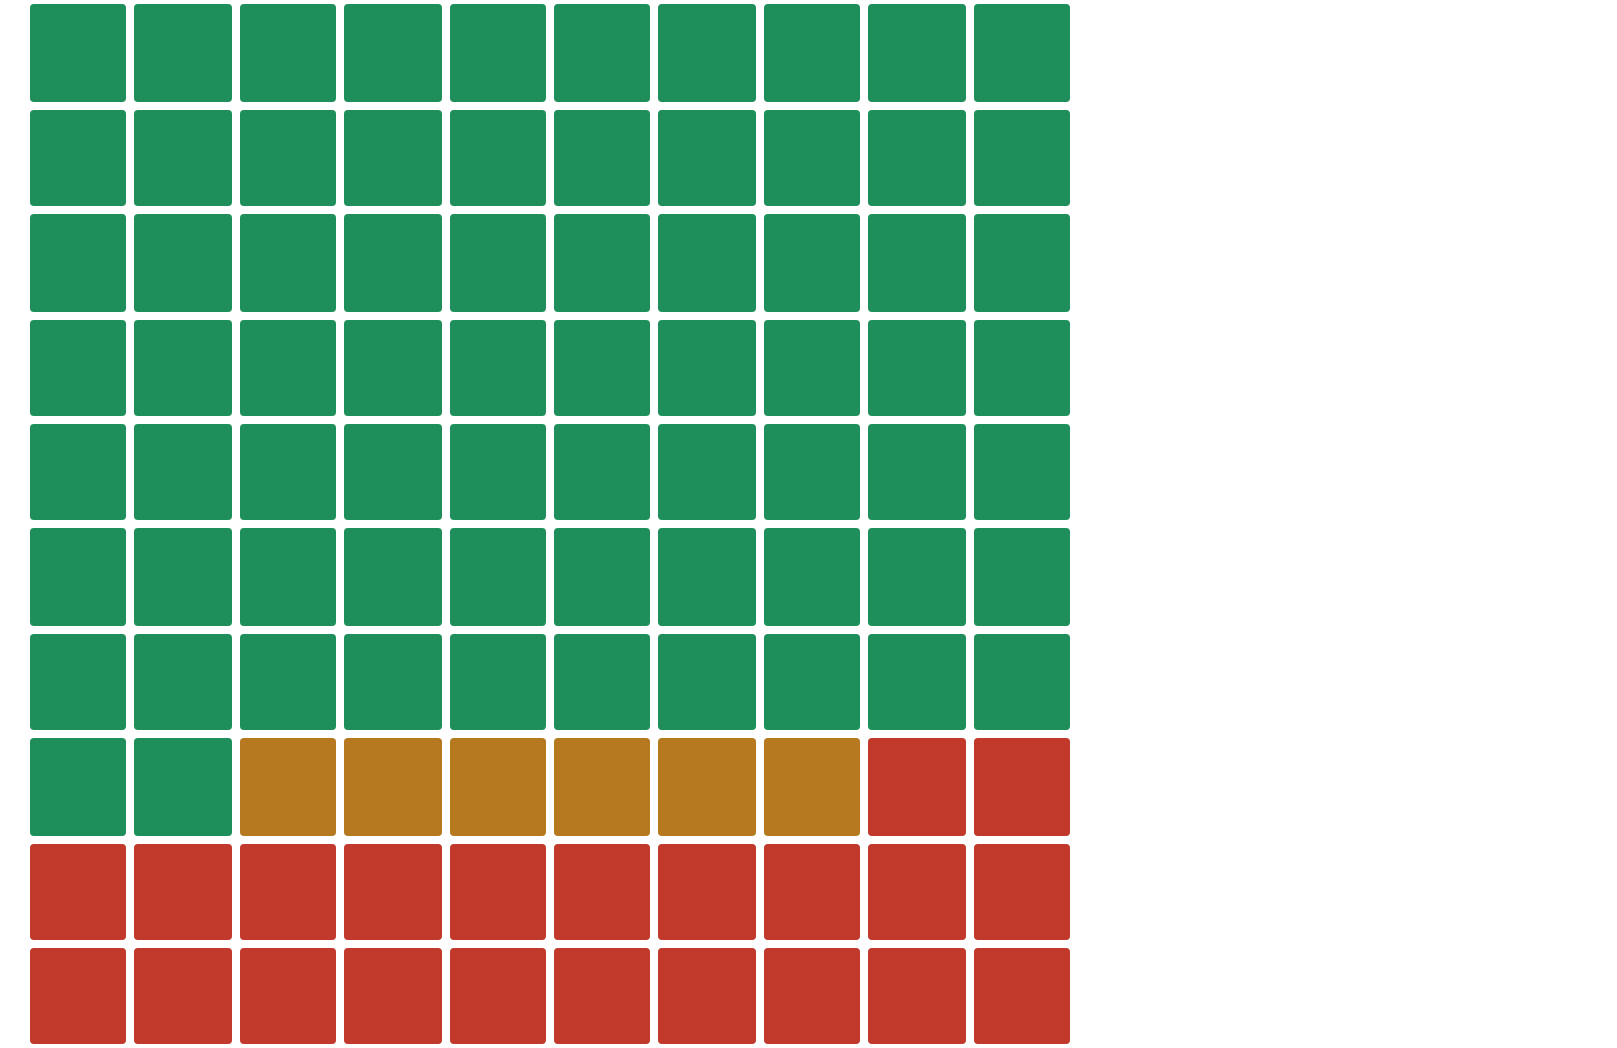
Divide the green squares by all 100 and you get 72.2%, the odds that booking a test ends in a licence. Count only the green and amber squares, the tests the examiner let finish, and the rate becomes 92.7%, a figure that has circulated as “Victoria’s pass rate”. Roughly 109,000 tests over 28 months, about 130 a day, were stopped early and vanish from that second denominator.
It also changes what “failing” means. In Victoria, 79.5 per cent of unsuccessful outcomes are tests stopped on the spot after a critical error, usually in the quiet-streets Stage 1 that learners assume is the easy part. RACV, citing VicRoads, puts immediate-termination errors at about three-quarters of failures. Most failed candidates made one disqualifying mistake in the first ten minutes and were driven back to the centre.
Media rankings inherit the same fuzziness. A 9 News segment in May 2026 reported Miranda as having Sydney’s highest fail rate at 66 per cent, while AUDrive’s compilation of TfNSW data has Miranda among Sydney’s better performers at roughly 60 per cent, a product of different windows and different counting for the same suburb. When someone hands you a pass rate, the question to ask is what it divides: everyone who booked, or only the candidates whose tests ran to the end.
What fails people
Across the datasets, failure concentrates on a short list of behaviours rather than spreading across everything:
Instant-fail errors dominate; in NSW a single critical error ends the test regardless of everything else: speeding, a missed head check at a stop sign or lights, giving way incorrectly, or touching a phone. The ACT’s 2025 data puts examiner intervention (the assessor grabbing the wheel or calling a stop) at 17.9 per cent of unsuccessful attempts, the single biggest cause there. Victoria, as above, ends four out of five failures with early termination.
Observation lapses fail the most candidates. Head checks and mirror routines are the errors instructors report most, because they are invisible habits under nerves. An examiner has only your movements to judge.
Preparation gaps show up in the knowledge test too. EzLicence’s November 2025 study of more than 18 million practice answers found speed-limit questions caused the most mistakes, with about 20 per cent of participants also answering vehicle-lighting questions wrong. If you are about to sit the DKT, drilling those two areas is where the return is. The online DKT costs $58 and includes unlimited attempts, which beats the $58-per-attempt in-person version on value as well as convenience.
What a fail costs
Since 1 July 2026 the NSW driving test fee is $72 per attempt, per the official fee schedule. Fail, and NSW rules make you wait seven days before rebooking, at full fee again. The expected number of attempts before a pass is one divided by the local pass rate, which turns the postcode gap directly into dollars:
Expected test fees before you pass
$72 per attempt, divided by the centre’s pass rate. Maths: expected attempts = 1 ÷ pass rate
Test fees only. Add at least one makeup lesson per fail at $70–$90, plus the seven-day wait each time, and the gap between booking at a hard centre and an easy one runs comfortably over $100 and several weeks. News.com.au’s reporting on EzLicence data found about 4 per cent of NSW candidates sit the test five times or more: $360 in fees before counting a single lesson.
So should you book somewhere easier?
Sometimes, and more often than people think: Service NSW’s own advice during the 2025 booking crunch was to “shop around”, because availability varies by centre. But test tourism has limits. Driving hours to Inverell for the statistics costs money, adds fatigue, and puts you on roads you have never practised. Khoury’s NRMA explicitly warns against fleets of Sydney candidates descending on regional towns, and learners themselves feel the risk: Oran Park student Celio Romero, weighing a trip to an unfamiliar centre, told the ABC “I don’t know if there’s a roundabout coming up or if it’s as busy. It would be more difficult.” Instructor Gerry Rivet has already watched candidates leapfrog outward, with Macarthur candidates pushing to Mittagong and Goulburn, and Goulburn candidates pushing to Wagga.
Should you travel for an easier test centre?
The centre-level data is published by the government itself, the rules are identical everywhere, and the candidate who books smart, rehearses the critical-error list and shows up with real hours is the candidate the system is designed to pass.
Methodology and sources
- NSW: Transport for NSW open data, Driver Licence Test Statistics, ~1.4 million tests mid-2022 to early 2026, as compiled and published by AUDrive (April 2026). Statewide and Sydney/regional figures are weighted by test volume; the 61.7% figure floating around is an unweighted average of centre rates and is not used here except to explain the difference.
- Victoria: Department of Transport and Planning FOI release CS019502, 492,504 car drive tests, January 2024 to April 2026, reported by AUDrive. VicRoads declined to release centre-level data. The “stopped test” category is AUDrive’s inference, cross-checked against RACV’s published figure that about three-quarters of Victorian failures are immediate terminations.
- Western Australia: WA Department of Transport FOI 2026-0140, 292,253 tests, via AUDrive. Individual centre rates for WA in AUDrive’s earlier tables partly use EzLicence estimates; the state average of 42.3% is official.
- Queensland: QLD open data 2024, via AUDrive. Small remote centres (under 50 tests a year) excluded from comparisons here.
- ACT, SA, TAS: first-attempt and repeat-attempt figures from news.com.au’s March 2026 report on EzLicence’s FOI-based study. ACT, SA, TAS and NT do not publish centre-level data.
- Context: Sydney Morning Herald, May 2024 (LGA-level rates and expert commentary); ABC News, August 2025 (waiting times, record test volumes); EzLicence Pass Rate Paradise (2022–2023 platform data, the origin of the 56% figure); 9 News broadcast, May 2026; NSW fee schedule effective 1 July 2026, verified October 2026.
- Caveats: data periods differ between sources (2022 to 2026). Cross-state comparisons should be read as indicative. Expected-cost figures are this article’s own calculations from the published pass rates and the official $72 fee.